The Soccer Opportunity Gap in Pictures
I think the best way to look at the study we published earlier today would be to look at a number of the charts and graphs that we included in today’s package.
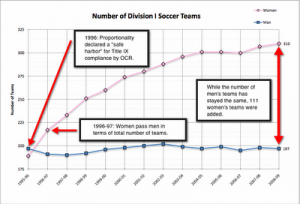
The key moment for Division I Soccer came in 1996, when the Department of Education’s Office of Civil Rights declared thatproportionality was a safe harbor for Title IX compliance. In this first graph, we take a look at what’s happened to the number of teams for both men and women since that action.
As you can see, once proportionality became a protected solution for NCAA members, the size of the men’s game was essentially frozen in terms of number of teams. Over the 13 year period, the net number of teams in Division I didn’t increase even though Division I added 27 members over the same period.
Next, we’ll look at the percentage of NCAA Division I schools that had men’s or women’s programs.
Again, just by looking at the chart, it ought to be clear that something happened in 1996 that triggered not just growth in the women’s game, but an essential freeze in the size of the men’s game. Next, we’ll take a look at the total number of athletes and how that’s changed over the period of the study.
Again, the pattern here ought to be abundantly clear. In 1996, OCR declared the safe harbor for proportionality. Just one year later, women passed men in terms of total number of Soccer athletes. Finally, 13 years after the declaration of the safe harbor, what was once rough parity in terms of total Soccer athletes has grown into a gap of more than 2,500 athletes in terms of women.
So what should be done to remedy the situation? We’ll take a look at that over the course of the day. Please stay tuned.


